
Chapter 19: Chemical Kinetics
Section 19-1: Collision Theory and Factors That Increase Chemical Reaction Rates
Section 19-2: Reaction Energy Profiles (Reaction Progress Diagrams)
Section 19-3: Reaction Mechanisms
Section 19-5: Determining Reaction Order and Rate Law Using Method of Initial Rates
Section 19-6: Determining Reaction Order and Rate Law Using Concentration Versus Time Data
Chapter 19 Practice Exercises and Review Quizzes
Section 19-1: Collision Theory and Factors That Increase Chemical Reaction Rates
However, for a collision between
reactant molecules to actually result in a reaction, the following requirements
must also be met:
A. The reactant molecules must
collide with the proper orientation or at the proper angle.
B. The total kinetic energy (energy
of motion) of the reactant molecules must be equal to or greater than the
required minimum energy, which is known as the activation energy and will be
different for each different chemical reaction. Therefore, the rates of chemical reactions will generally
increase when the percentage of reactant molecules that
possess the required activation energy is increased by increasing the temperature.
Section 19-2: Reaction Energy Profiles (Reaction
Progress Diagrams)
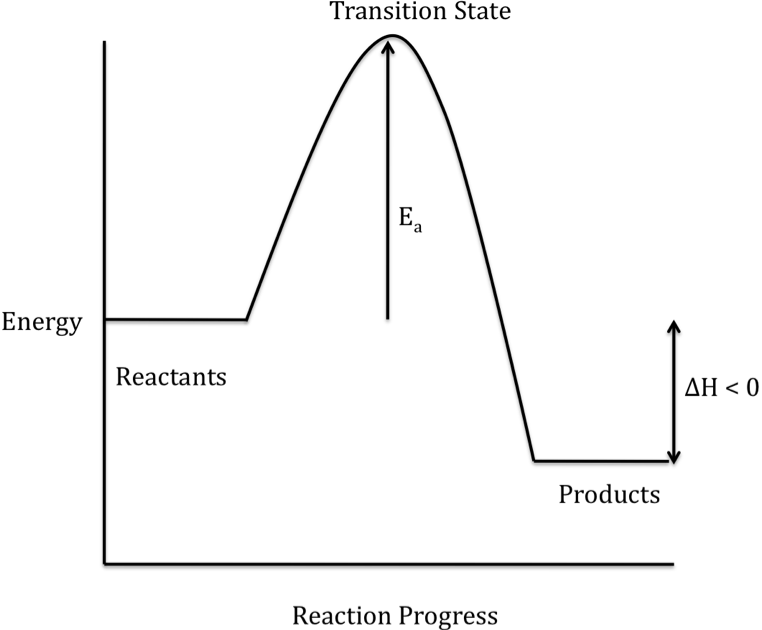
A reaction energy profile (or
reaction progress diagram) traces the changes in energy that occur as reactants
are transformed into products.
Reactant molecules that collide with the required activation energy are
able to form a higher-energy temporary species known as the transition state
(or activated complex) on the way to becoming product molecules. The activation energy (Ea)
is shown on a reaction energy profile as the difference in energy between the
reactants and the transition state.
The difference in energy between the reactants and products is
represented as ΔH on a reaction energy profile. When the products have a lower energy than the reactants,
the reaction is exothermic and energy is released during the overall reaction:
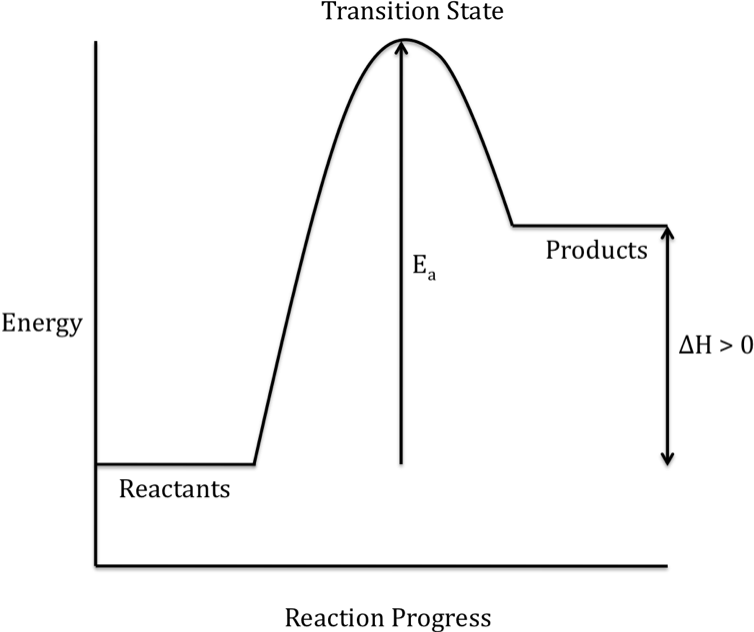
When the products have a higher
energy than the reactants, the reaction is endothermic and energy is absorbed
during the overall reaction:
Note that the rate of a chemical
reaction will be higher when the required activation energy is lower, but the
rate of a chemical reaction does not depend on ΔH.
Section 19-3: Reaction Mechanisms
A reaction mechanism depicts at the
molecular level the actual series of elementary steps that occur during a
chemical reaction and add up to give the overall balanced equation. If the hypothetical reaction 2 A + B → C occurred in a single step, three
reactant molecules would need to collide simultaneously. Alternatively, it is possible that the
reaction occurs via a two-step mechanism wherein two A molecules collide in a
first step to form an intermediate (Int.), then the intermediate collides with
a B molecule in a second step to form the product C:
Step
1: A + A → Int.
Step
2: Int. + B → C
Note that the intermediate is
formed in one step but then consumed in the second step, so the intermediate
will not appear in the overall balanced equation:
Sample Exercise 19A:
The following mechanism has been
proposed for a reaction:
Step
1: NO + NO → N2O2
Step
2: N2O2 + O2
→ 2 NO2
Identify the intermediate and write
the overall balanced equation for the reaction.
Solution:
N2O2 is
formed in the first step but then consumed in the second step, so N2O2
is the intermediate that cancels out of the overall balanced equation 2 NO + O2
→ 2 NO2.
Section 19-4: Catalysis
The addition of a catalyst to a
reaction mixture allows the reaction to proceed via an alternate mechanism that
is faster overall than the uncatalyzed
mechanism. For example, if the
hypothetical uncatalyzed reaction A + B → D proceeds via a slow one-step
mechanism, addition of a catalyst (Cat.) can increase the reaction rate by
providing the following faster two-step mechanism:
Step 1: A + Cat. → Int.
Step
2: Int. + B → D + Cat.
Note that the catalyst is consumed
in the first step but then produced in the second step, so the catalyst will
not appear in the overall balanced equation. Also, a relatively small quantity of the catalyst must be
added initially because each catalyst molecule produced in the second step can
be used again as a reactant in the first step.
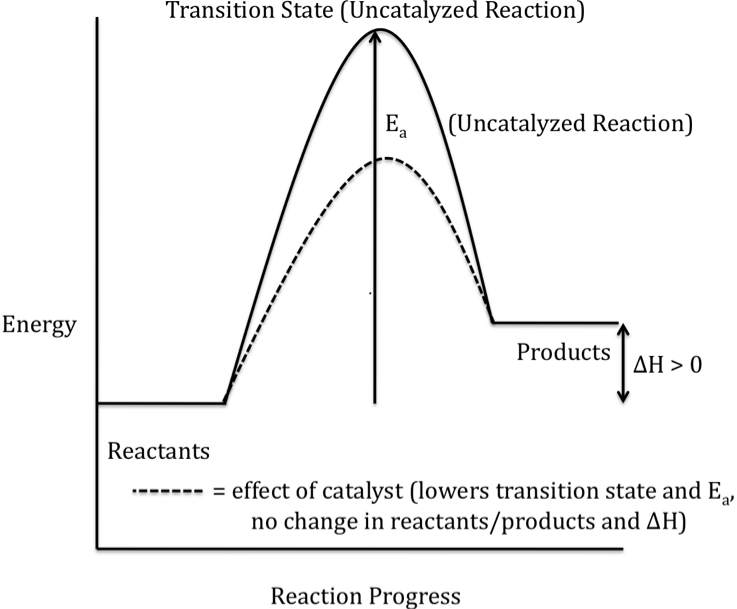
The alternate mechanism provided by
a catalyst results in a lower-energy transition state and, therefore, a lower
activation energy for the catalyzed reaction, as shown in the reaction energy
profile below for an exothermic reaction (solid curve represents the uncatalyzed reaction):
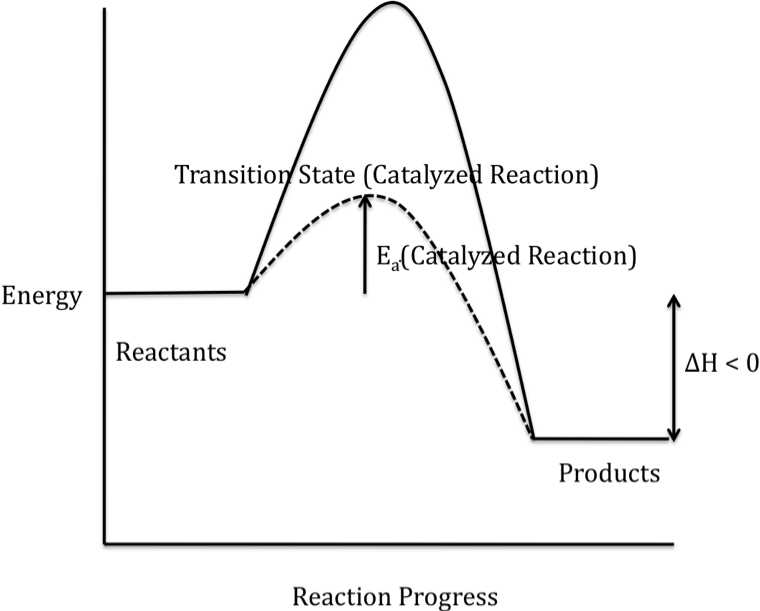
Note that ΔH is unaffected by the
addition of a catalyst because the energies of both the reactants and the
products are unchanged when a catalyst is added.
Section 19-5: Determining Reaction Order and Rate Law
Using Method of Initial Rates
The rate of a chemical reaction
typically indicates a change in the concentration of a reactant or product
during a certain period of time in units such as M•s-1 or M•min-1. If we know the rate of a reaction in
terms of one reactant or product, we can determine the rate of the reaction in
terms of any other reactant or product using a mole ratio from the balanced
equation as follows:
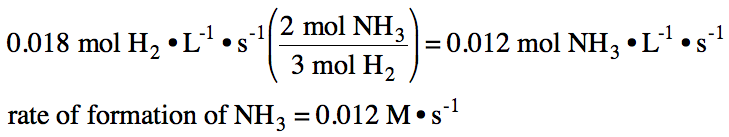
Sample Exercise 19B:
If the rate of disappearance of
hydrogen gas in the reaction N2 (g) + 3 H2 (g) → 2 NH3 (g) is found to
be 0.018 M•s-1, what is the rate of formation of NH3 gas?
Solution:
A rate law or rate equation expresses the relationship between
reaction rate and the molarities of the reactants. For a reaction of the type aA + bB → products, where a and b are
coefficients, the rate law has the following form:
rate = k[A]x[B]y
Each particular reaction has its
own unique rate constant k. The
exponent x is known as the order with respect to A, and the exponent y is known
as the order with respect to B. The sum of x and y is known as the overall reaction order. Although the orders x and y may be
equal to the coefficients a and b, these orders are often unequal to the
coefficients and in some cases can be negative, zero, or fractional.
The orders x and y and the value of
the rate constant k can be determined experimentally using the method of initial rates. A series of experiments are performed
in which at least one of the initial reactant molarities are changed each time,
and the initial reaction rate is measured for each experiment. The data table is then utilized as
follows:
1. For each separate experiment,
the initial reactant molarities and initial rate are substituted into the rate
law.
2. Two experiments are identified
where only one of the initial reactant molarities are changed. The rate laws for these two experiments
are then divided to find the order with respect to one of the reactants.
3. The rate laws for a different
combination of two experiments are divided to find the order with respect to
the second reactant.
4. Once both orders have been
determined, the initial reactant molarities and initial rate from any one of
the experiments are substituted into the rate law to calculate the value of the
rate constant k.
Sample Exercise 19C:
For the reaction 2 NO (g) + 2 H2 (g) → N2 (g) + 2 H2O (g), the following data were collected:
Experiment
|
[NO] (M)
|
[H2]
(M)
|
Initial
Rate (M•min-1)
|
1
|
0.11
|
0.11
|
0.0010
|
2
|
0.11
|
0.22
|
0.0020
|
3
|
0.22
|
0.44
|
0.016
|
Determine the overall order of the
reaction, write the rate law, and calculate the value of k with units.
Solution:
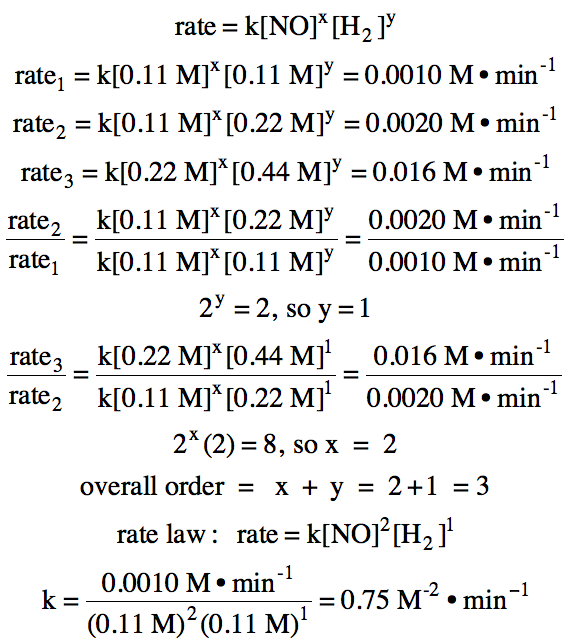
Note that the initial reactant
molarities and initial rate from Experiment 2 or Experiment 3 could also have
been used to calculate the value of k.
Section 19-6: Determining Reaction Order and Rate Law
Using Concentration Versus Time Data
For a reaction of the type aA → products, the rate law has the
following form: rate = k[A]x . For each different reaction order, we
can use calculus to derive an equation known as an integrated rate
law that allows us to calculate the molarity of A at different points in time
(t) during the reaction. Starting
with the initial molarity of A at t = 0, [A]0, the integrated rate
law yields the molarity of A for any value of t, [A]t.
To determine reaction order, an
alternative to the method of initial rates that requires only a single
experiment involves monitoring the concentration of A over time during the
reaction. The concentration versus
time data can then be analyzed to determine the reaction order as follows:
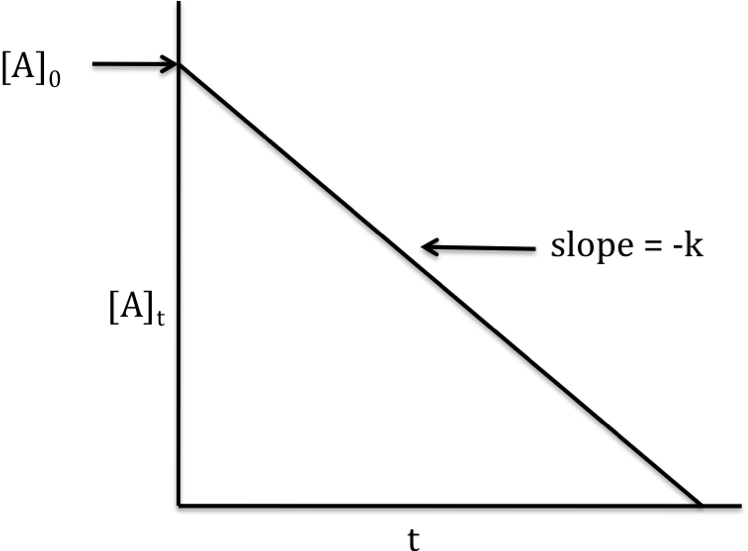
Zero-order reaction
rate
law: rate = k[A]0 = k
integrated
rate law: [A]t = -kt +
[A]0
If the reaction is zero-order, a
graph that plots [A]t on the y-axis versus t on the x-axis will
yield a straight line with slope = -k and y-intercept = [A]0:
First-order reaction
rate
law: rate = k[A]1
integrated
rate law: ln[A]t = -kt
+ ln[A]0
If the reaction is first-order, a
graph that plots ln[A]t on the y-axis versus t on the x-axis will
yield a straight line with slope = -k and y-intercept = ln[A]0:
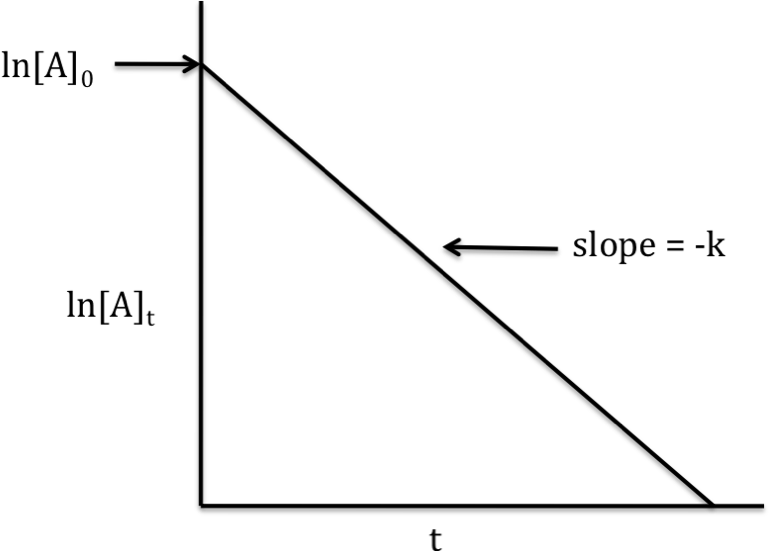
Note that any concentration of A
below 1 M will yield a negative value for ln[A]t. Thus, data points may have a y-value
below zero on the graph above.
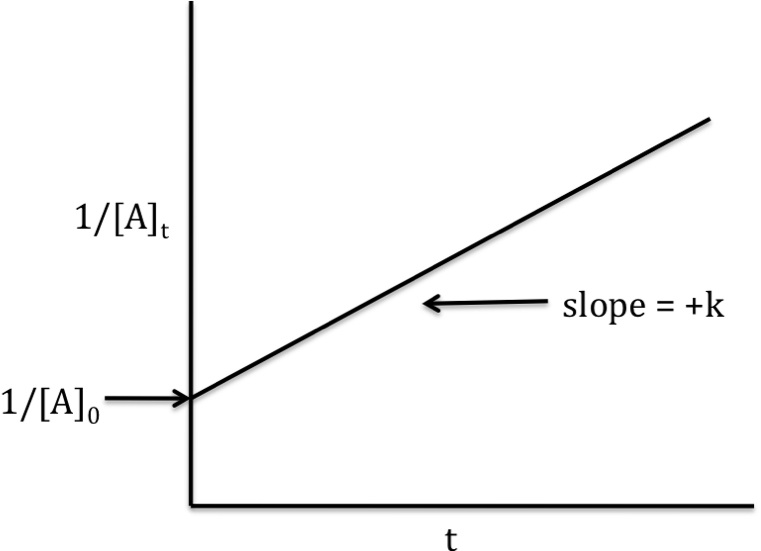
Second-order reaction
rate
law: rate = k[A]2
integrated
rate law: 1/[A]t = kt +
1/[A]0
If the reaction is second-order, a
graph that plots 1/[A]t on the y-axis versus t on the x-axis will
yield a straight line with slope = +k and y-intercept = 1/[A]0:
After the [A]t versus t
data are collected experimentally, the three graphs above of [A]t versus t, ln[A]t versus t, and 1/[A]t versus t are
plotted. The graph on which the
data points most closely fit a straight line indicates the reaction order as
follows:
best
straight line fit
|
reaction
order
|
[A]t v. t
|
0
|
ln[A]t v. t
|
1
|
1/[A]t v. t
|
2
|
Sample Exercise 19D:
Concentration versus time data were
collected for the reaction 2 H2O2 (aq) → O2 (g) + 2 H2O
(l). Graphs of [H2O2]t v. t, ln[H2O2]t v. t, and 1/[H2O2]t v. t were plotted, and the data points on the graph of ln[H2O2]t v. t were found to fit a straight line most closely. Is the reaction zero-order, first-order, or second-order?
Solution:
Since the data points on the graph of ln[H2O2]t v. t had the best straight line fit, the reaction is first-order.
Chapter 19 Practice Exercises and Review Quizzes:
19-1) Sketch a completely-labeled
reaction energy profile (reaction progress diagram) for an endothermic reaction. Indicate any effects a catalyst would
have on the sketch.
Click for Solution
19-2) The
following mechanism has been proposed for a reaction:
Step
1: H2 + ICl → HI + HCl
Step
2: HI + ICl
→ HCl + I2
Identify the intermediate and write
the overall balanced equation for the reaction.
Click for Solution
19-2) HI is formed in the first step but
then consumed in the second step, so HI is the intermediate that cancels out of
the overall balanced equation 2 ICl + H2 → 2 HCl +
I2.
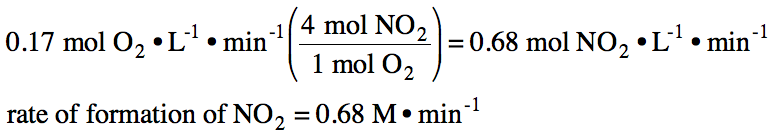
19-3) If the rate of formation of oxygen gas in the reaction 2 N2O5 (g) → 4 NO2 (g) + O2 (g) is found to be 0.17 M•min-1, what is the rate of formation of NO2 gas?
Click for Solution
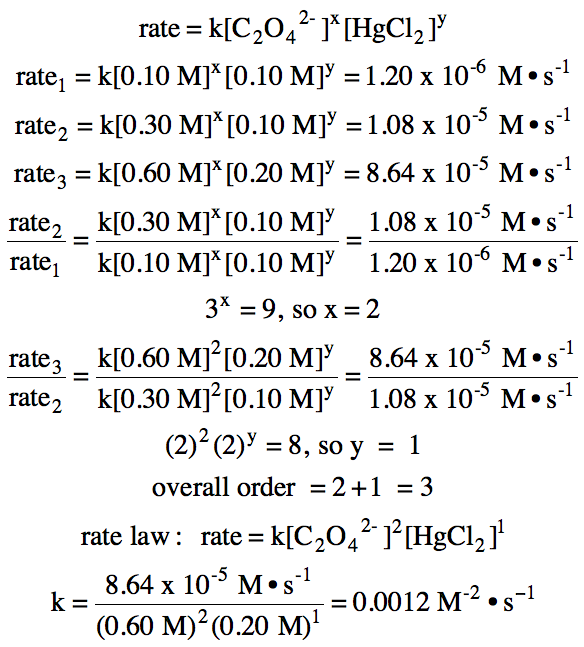
19-4) For the reaction C2O42- (aq) + 2 HgCl2 (aq) → Hg2Cl2 (s) + 2 CO2 (g) + 2 Cl- (aq), the following data were
collected:
Experiment
|
[C2O42-]
(M)
|
[HgCl2]
(M)
|
Initial
Rate (M•s-1)
|
1
|
0.10
|
0.10
|
1.20 x 10⁻⁶
|
2
|
0.30
|
0.10
|
1.08 x 10⁻⁵
|
3
|
0.60
|
0.20
|
8.64 x 10⁻⁵
|
Determine the overall order of the
reaction, write the rate law, and calculate the value of k with units.
Click for Solution
19-5) Concentration versus time
data were collected for the reaction C4H6 (g) → 1/2 C8H12 (g). Graphs of [C4H6]t v. t, ln[C4H6]t v. t, and 1/[ C4H6]t v. t were plotted, and the data points on the graph of 1/[C4H6]t v. t were found to fit a straight line most closely. Is the reaction zero-order, first-order, or second-order?
Click for Solution